Wicked problems are”… a class of social system problems which are ill-formulated, where the information is confusing, where there are many clients and decision-makers with conflicting values, and where the ramifications in the whole system are thoroughly confusing.”
— Horst Rittel
Wicked Problem:
FOOD SUSTAINABILITY
FOOD SUSTAINABILITY
Teammates: Edith, Maurane & James
Brief:
In the last few decades, people have become more aware of the importance of good nutrition. But organic food is not accessible to everyone, and is often only available to people who can afford it.
Supermarket chains and big food corporations benefit more from the rise of the organic food market than the local producers. Instead of fixing the problem, they are harming the environment with unsustainable models. How Might We help people access local seasonal produce, while also fostering fair and honest relationships between producers and customers?
We read the brief and so we began our journey using Design Thinking as our guide. Our point of departure began with a brainstorming session, we tried to identify precisely and accurately what we thought was being asked of us to solve. The "How Might We" phrase helped us to identify the problem. You might ask, why must we identify the problem? This will be our measurement of "success". We will know that we were "successful" when we have responded to these needs and problems. This will also help us determine what is the MVP, Minimum Viable Product.
Brainstorm: In collaboration mode, we created and then grouped post-its/cards into categories to try and make sense of the subject. Defining the subject by means of identifying repeating discoveries, "tendencies" and potential clues that will help us solve our mystery. The word "clue" makes me think of Sherlock Holmes, so I put on my thinking cap and I continue to ask questions and to dig deeper, observing and being curious. These categories were the result of re-reading the brief and discussing at great length, we came up with these categories around which we carefully constructed what we wanted to know more about. I admit, we were a little lost and confused.
We used Dot voting as a way to declare what we thought to be the best findings, to create common ground, to be able to share our findings with each other and all those involved with our project. We kept our collaborative findings and workspace open for others to see our evolution. We are learning as we go along.
We identified what we seemed to be categories that would help us define what is to be explored, see below.
Categories
1. Farmers (who does this concern)
a. Origin of Farm Production (local)
a. Origin of Farm Production (local)
b. Advice from Farmers (seasonal)
2. Education/Public awareness (ecological)
3. Prix/Final Costs (financial impact)
4. Inspiration/Pre-existing models (local, fiscal, financial, economical, healthy)
Secondary Research: Each team-member participated doing secondary research. Information was gathered, shared among each other and synthesized. We wanted to know what kinds of services and products or subscriptions, similar to this, exist already. We wanted to know "if" and "how" those existing models worked, how they identified their clients and their target market, getting closer to what might be defined as a response to the need or the friction that is being addressed. We are trying to identify the "friction" or the "pain-point" so that we may respond to "it".
Findings from secondary research of were grouped which gave some clues but the sources were definitely biased and it was clear that reliable data would take more detective work. We need our own questions and to do our own research. Here below is a screenshot, a portion of our post-its created, in search of “asking the right questions”.
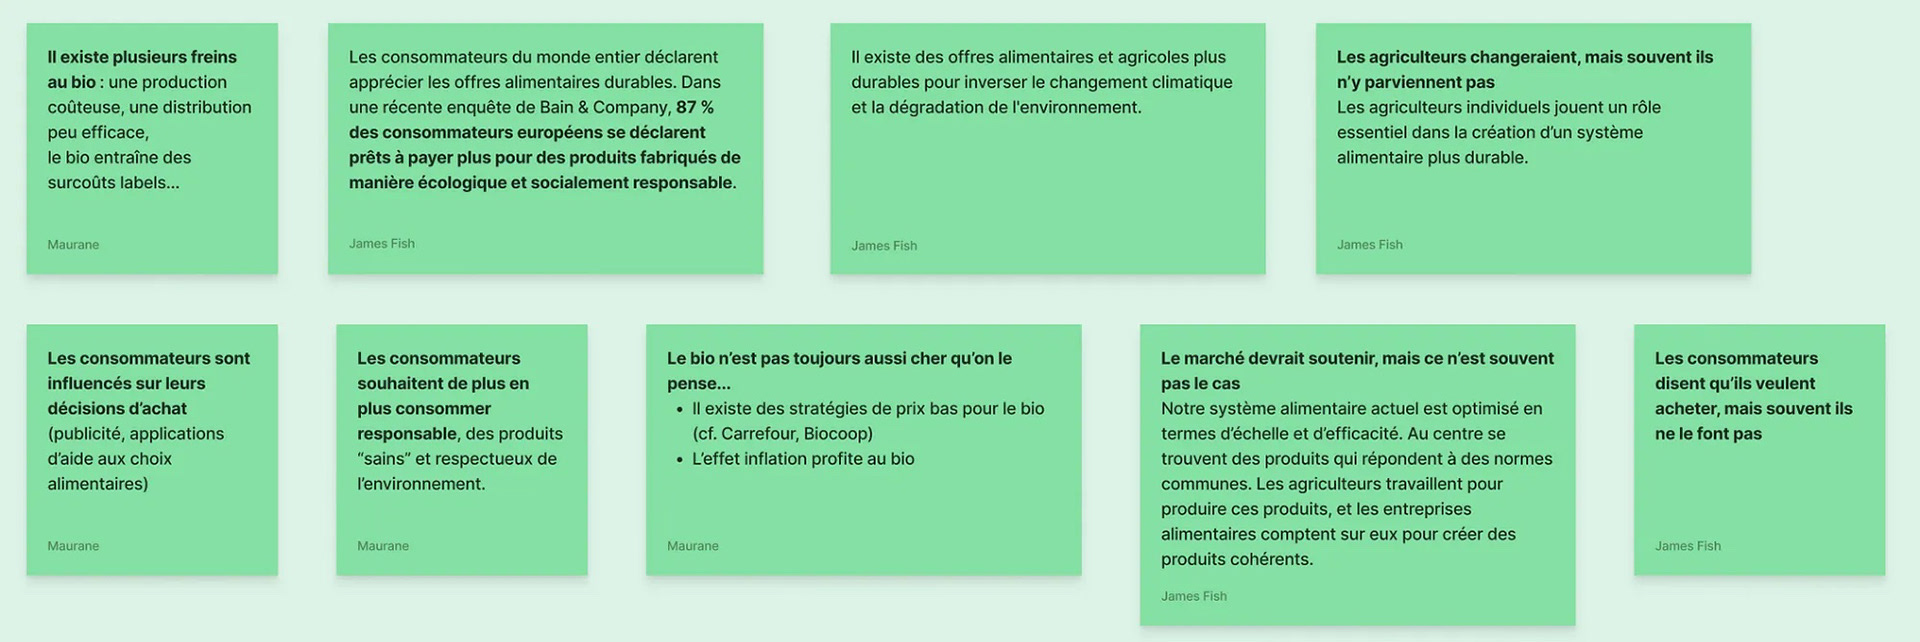
We created boards such as this to help us identify our subject, putting them into groups and eventually using voting to help isolate the most relevant.
Discovery phase
Qualitative Research: The team worked together to prepare questions to be used for interviews. We held interviews to discover more about user's experiences and we are curious to hear what people have to say about the subject. We invited 5 different people with whom we joined together via video-conferencing, we recorded the interviews and took notes.
The results helped us gather insightful data that helped us understand more clearly. This documents briefly our first phase of discovery, part one of the Design Thinking process.
Quotes collected from the interviews :
“Sometimes I buy organic” -Eglantine
“Sometimes I buy organic but I pay attention to price” -Sylvain
“I consume organic and I buy local” -Chloe
“I buy products according to season” -Astrid
“Sometimes I buy organic but I pay attention to price” -Florence
Define
Affinity maps & Dot voting:
After the interviews, we went back and analysed our notes & transcriptions taken from the interviews and isolated that data into “chunks” of information, or smaller phrases of information and put them onto “post-its”. The post-its were then re-organised into groups that were based on the responses to the questions that we had. Keep in mind that these were dialogs and the kinds of questions that we asked were open-ended and they had the freedom to respond as they wished, so we gathered more information than we asked for. The organising of post-its required lots of thinking-out-loud as we were three to share this endeavor remotely, using FigJam. We explored many possibilities to organise the data. We even tried using the integrated IA feature that is able to propose grouping based on the content of the post-its. The results were interesting, it came up with categories that were relevant and at first glance, quite accurate. But after further examination we found that the organisation was based on the words in the notes but there was a lack of understanding, therefore not effective for us at this phase. We organised our data in groups, we found significant categories and subcategories that we named. By the end of our Affinity Diagram, and much discussion, we used Dot Voting to filter out the ‘Important’ parts of data gathered, so that we may move forward to the next phase.
Personas...
Based on the data collected from the interviews, we were able to create an ideal persona and as well as accommodating the secondary persona. This helped remind us “who” the user is, determine what the product should do or how it should behave, building consensus and commitment of the functionality, essential features & design direction, helping personalise the product, avoiding to be generic while helping the team be much more interested in creating a user-centric product. Personas become part of the reasoning and part of the onboarding. Get leadership support, involve all stakeholders, explain how to use personas, present personas & user journeys together. We now design for “Pratique Steve”.
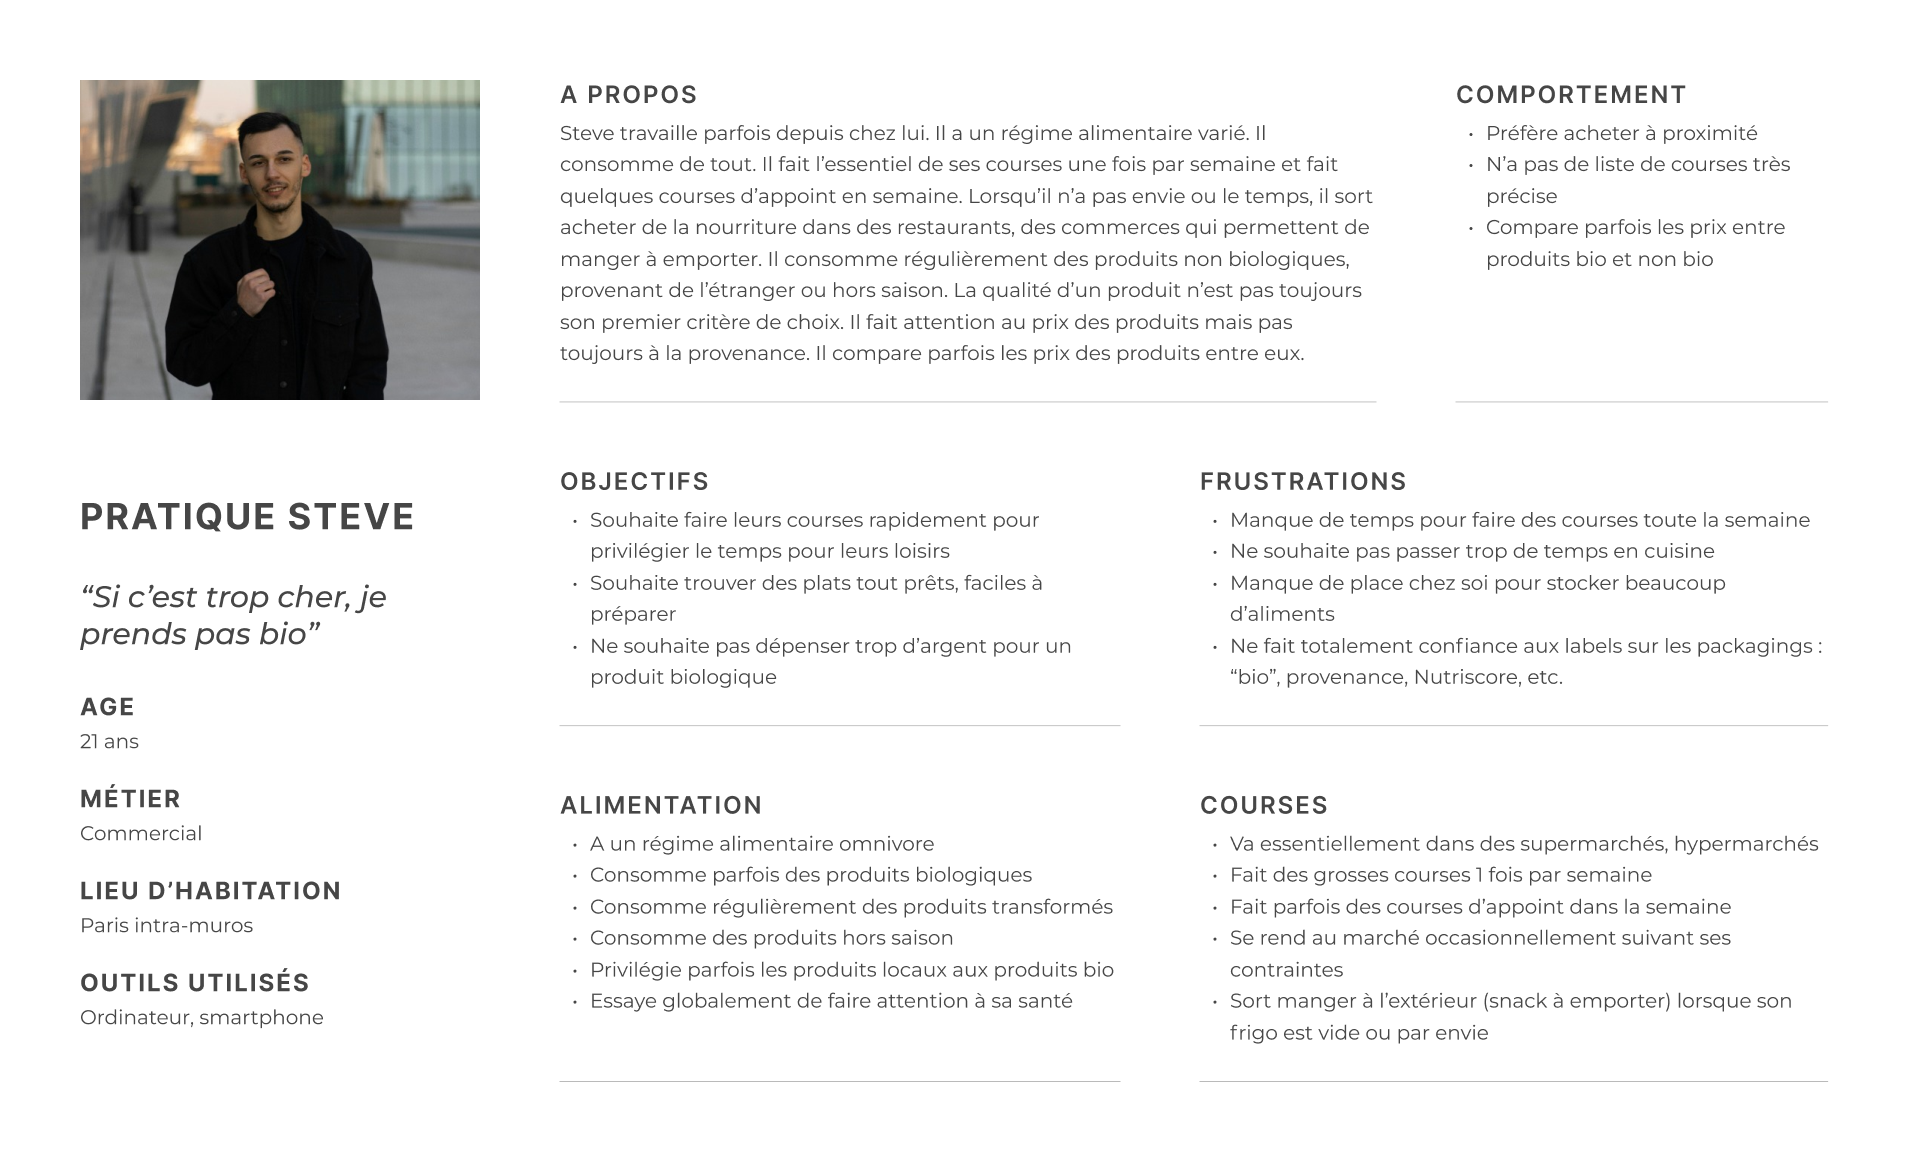
Persona: Steve
Journey Map
The Journey Map helped us identify a series of steps from A to Z to realise his need to do his shopping for the week, along the way we found moments that we problematic and difficult, we can see through the eyes of the persona, based upon real findings gathered from our interviews, to identify “pain points” that are represent, the “opportunities” to make better.

Journey map : helps identify the opportunities
Opportunities
● How can we reduce the time we spend shopping?
● How can we make organic less expensive?
● How can we raise awareness of organic, local and seasonal produce?
● How can we offer healthy, high-quality food for quick meals?
● How can we provide all-day access to organic, local and seasonal produce?
Reflection
(my personal journal entry)
"Moving fast in a sprint is exciting and that intensity brings along with it spontaneity and rapid problem solving. Collaboration with people that we dont have the habit of working with can be stressful and I appreciate the politeness and courtesy that my colleagues have for each other. Well, we are a small team of 3 and that is advantageous because we all have the desire to participate and to listen, this has been a good experience as there are opportunities to grow and to learn. I’m not afraid of doing the wrong thing and maybe that is because I have made a pact with myself to be humble and to have no fear…or less fear :) Breathe deep, meet the challenges head on and be in the moment, doing what I can do, doing things I feel good about, with myself at the end of the day..."
Problem statement
Active urban consumers need access to organic, local and seasonal produce at affordable prices, close to home, because they’re time-poor and price-conscious.
Ideation Workshop
We used the “Crazy 8” method, a technique for rapid sketching, picturing solutions to the problem statement. Each member participating, we used an Eisenhower Matrix to evaluate the Difficulty (less-more) vs. Priority (high-low) to establish where these ideas were. We had ideas that landed in all four quadrants, we conducted silent voting, adding our thoughts to each.
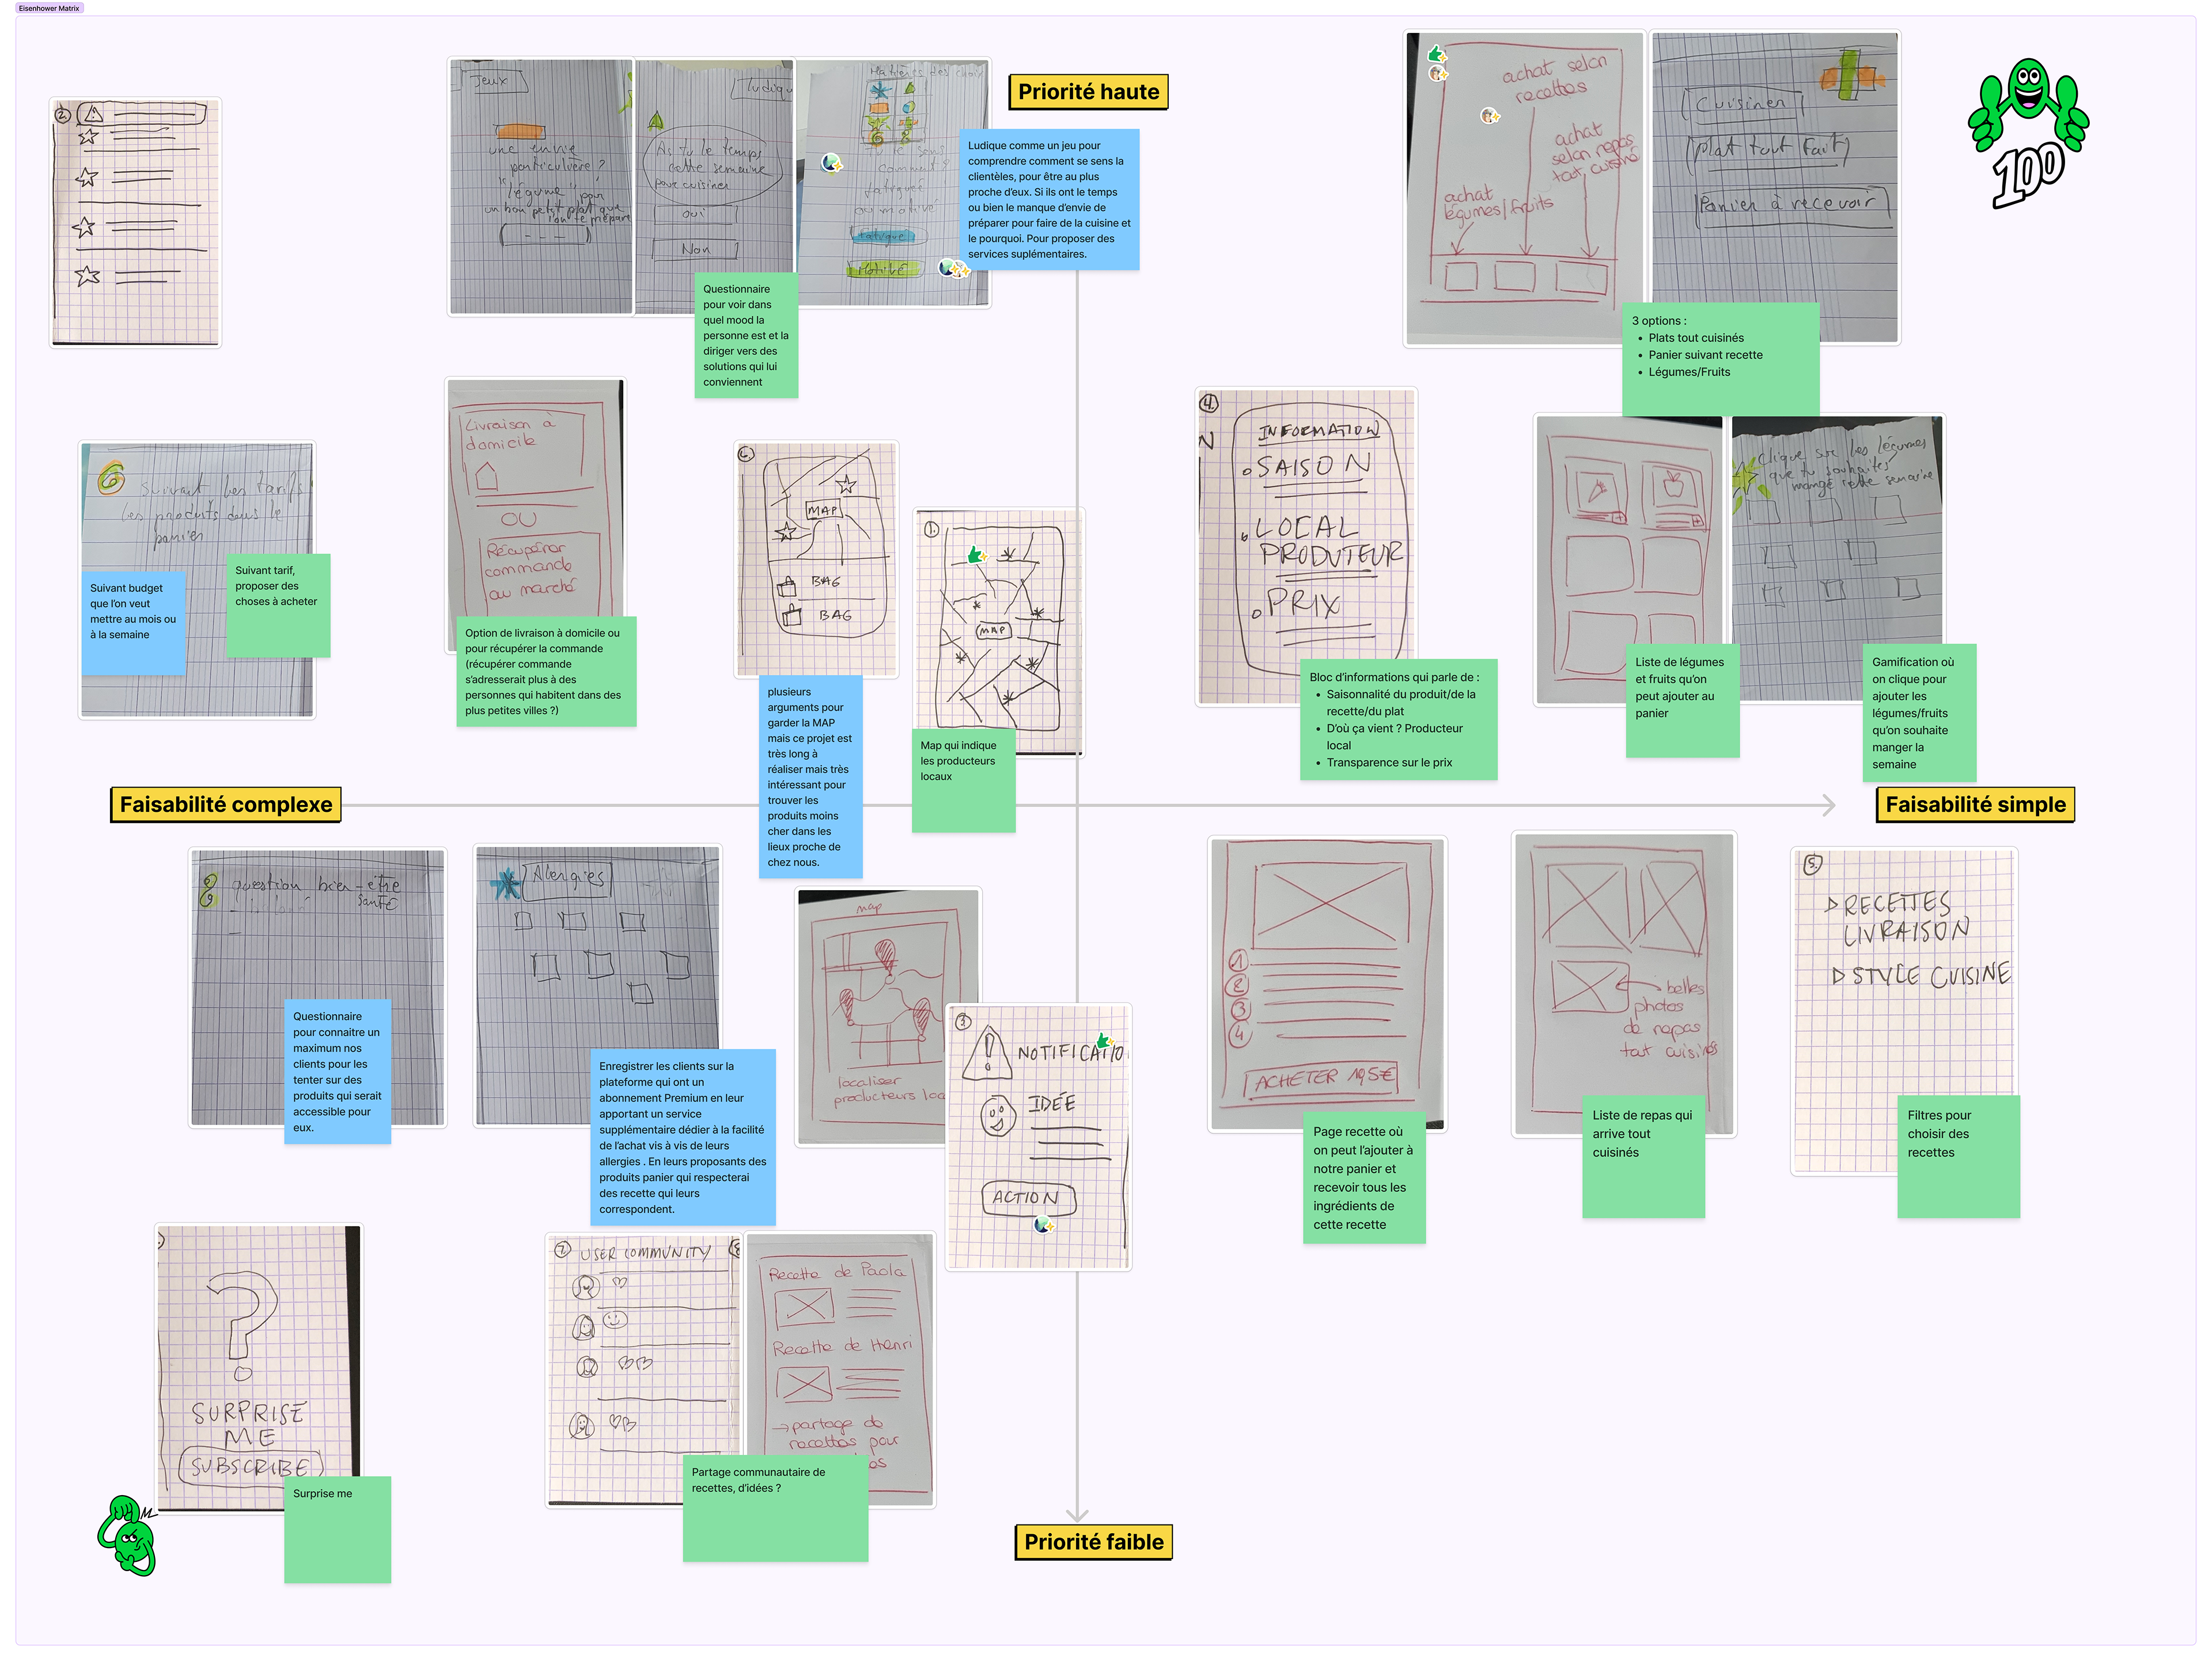
Eisenhower Matrix
The Eisenhower Matrix, helped us define what was a priority for the Minimum Viable Product and the ease or difficulty of integrating these features. This step helped us realize a flow chart; the series of screens to do a given task.
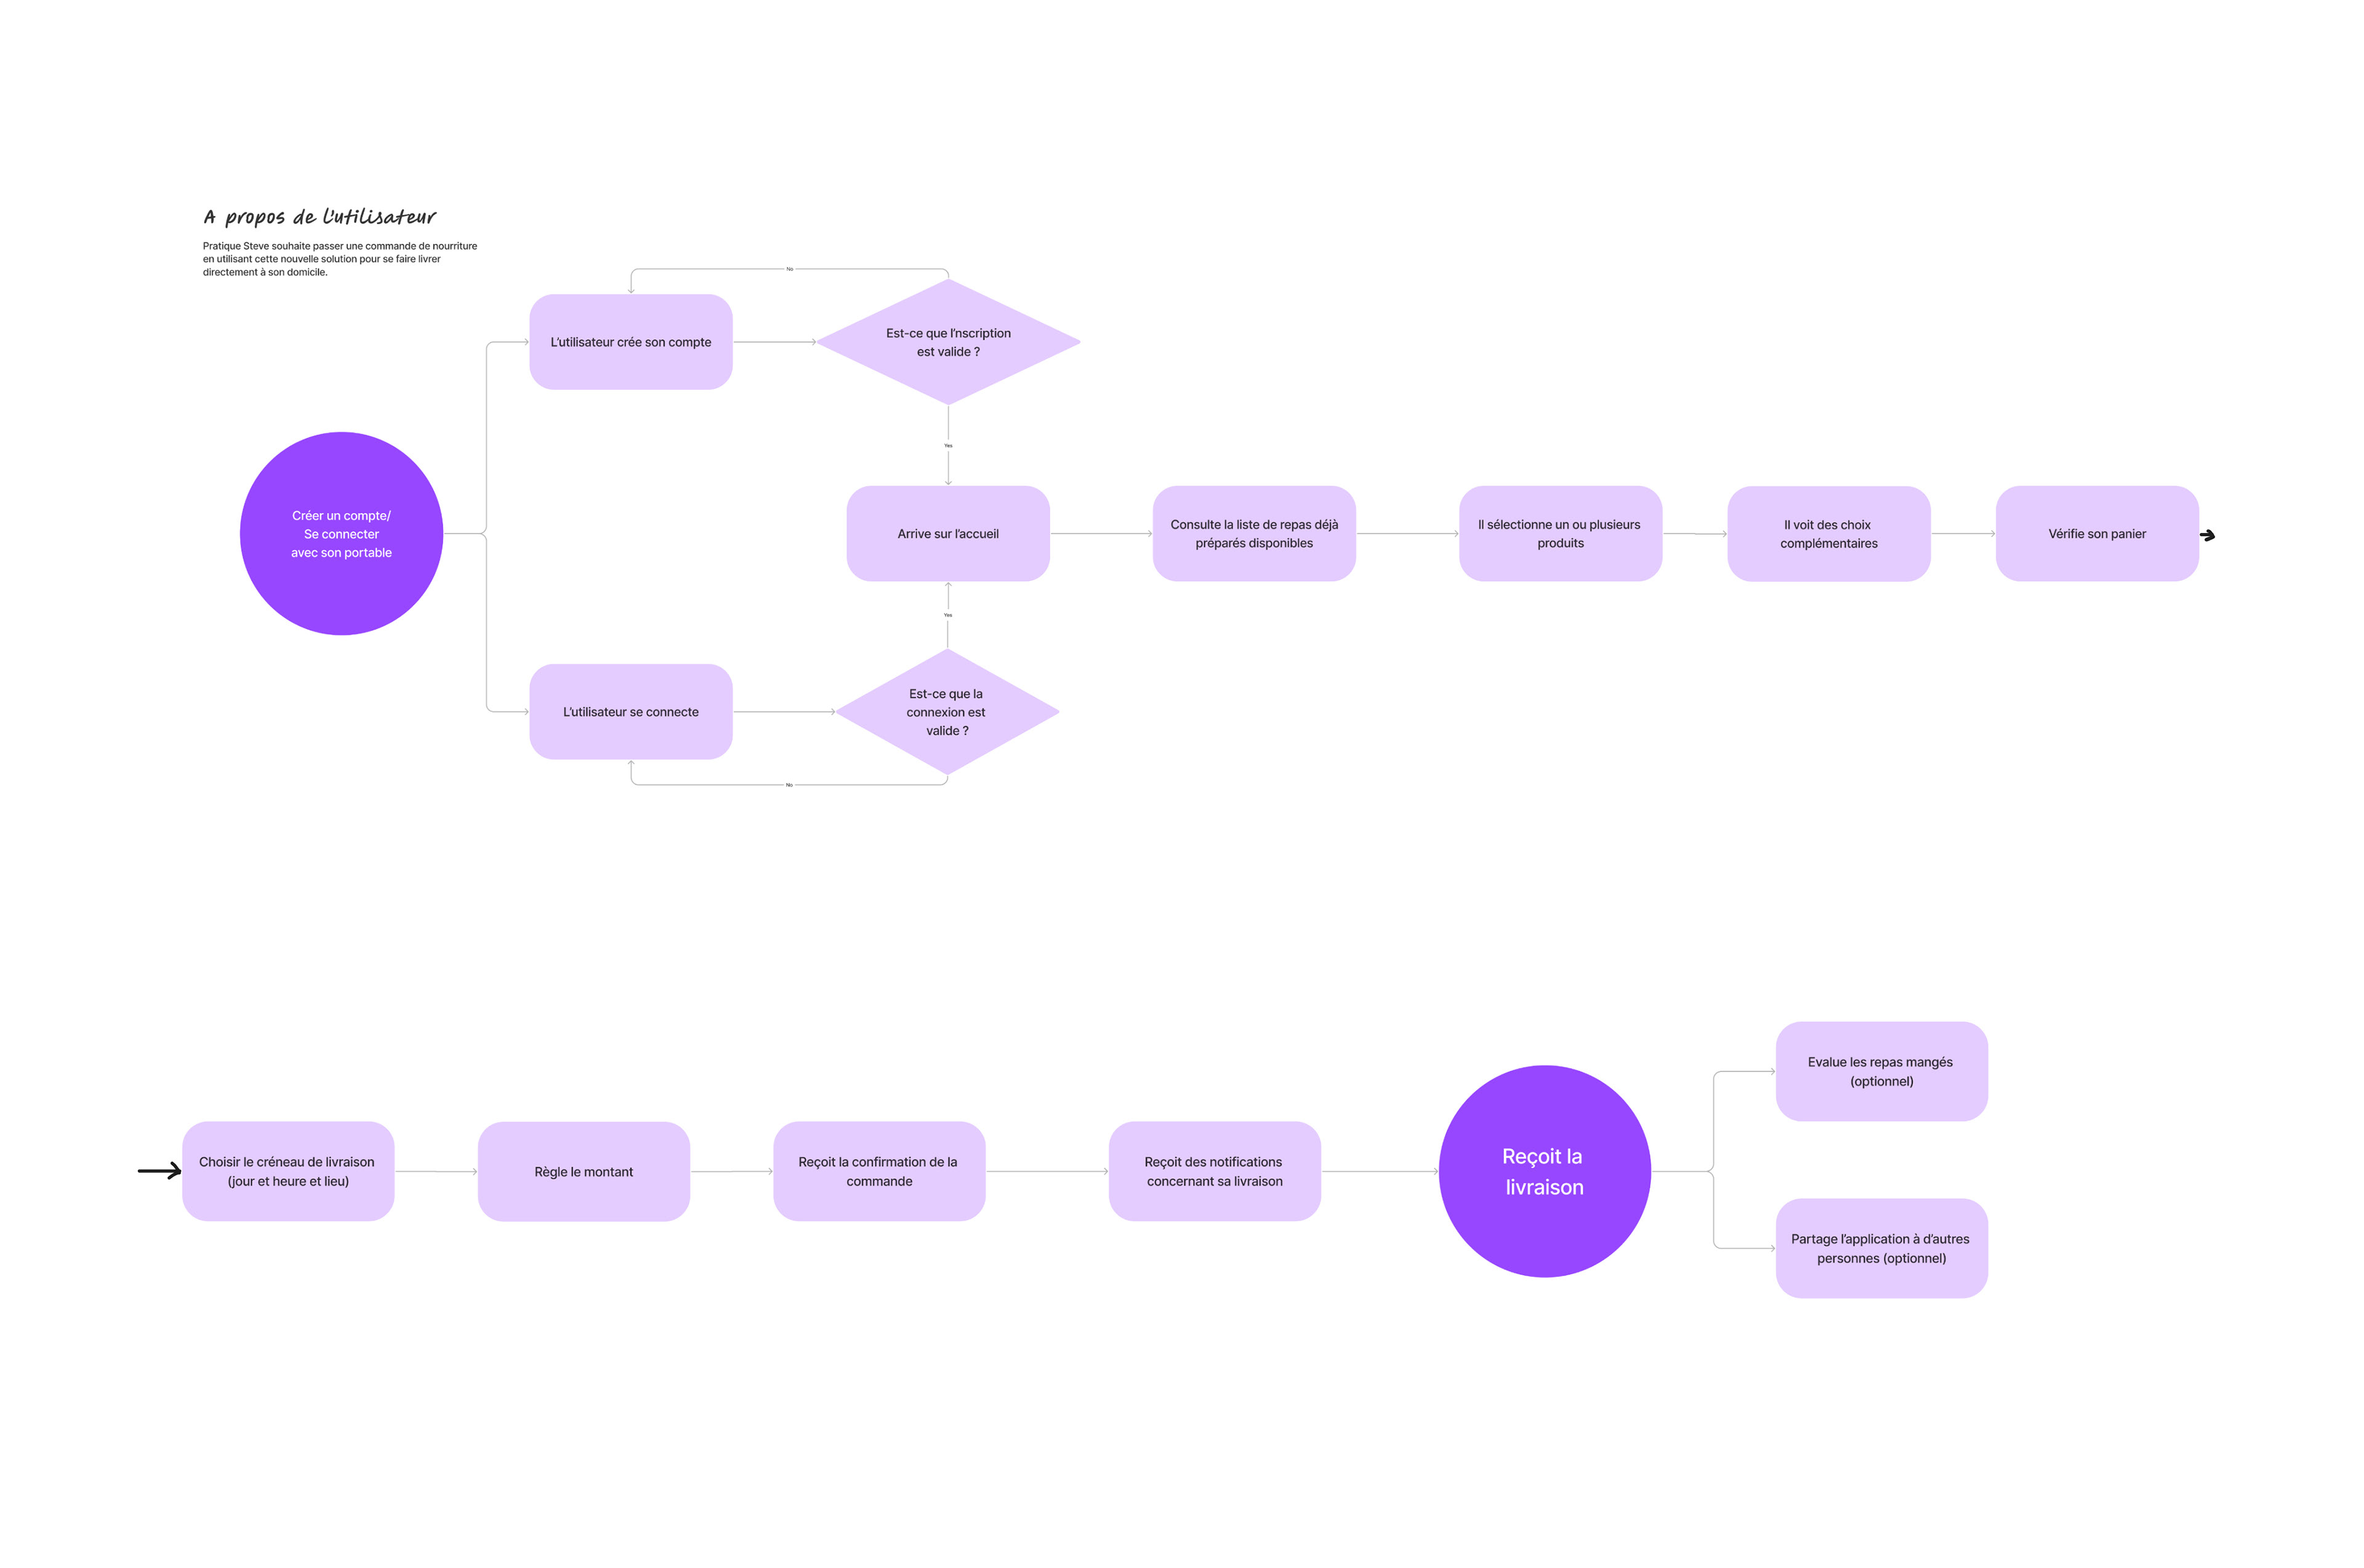
this is a flowchart to help identify the steps and screens to be created.
Lo-fi User Flow
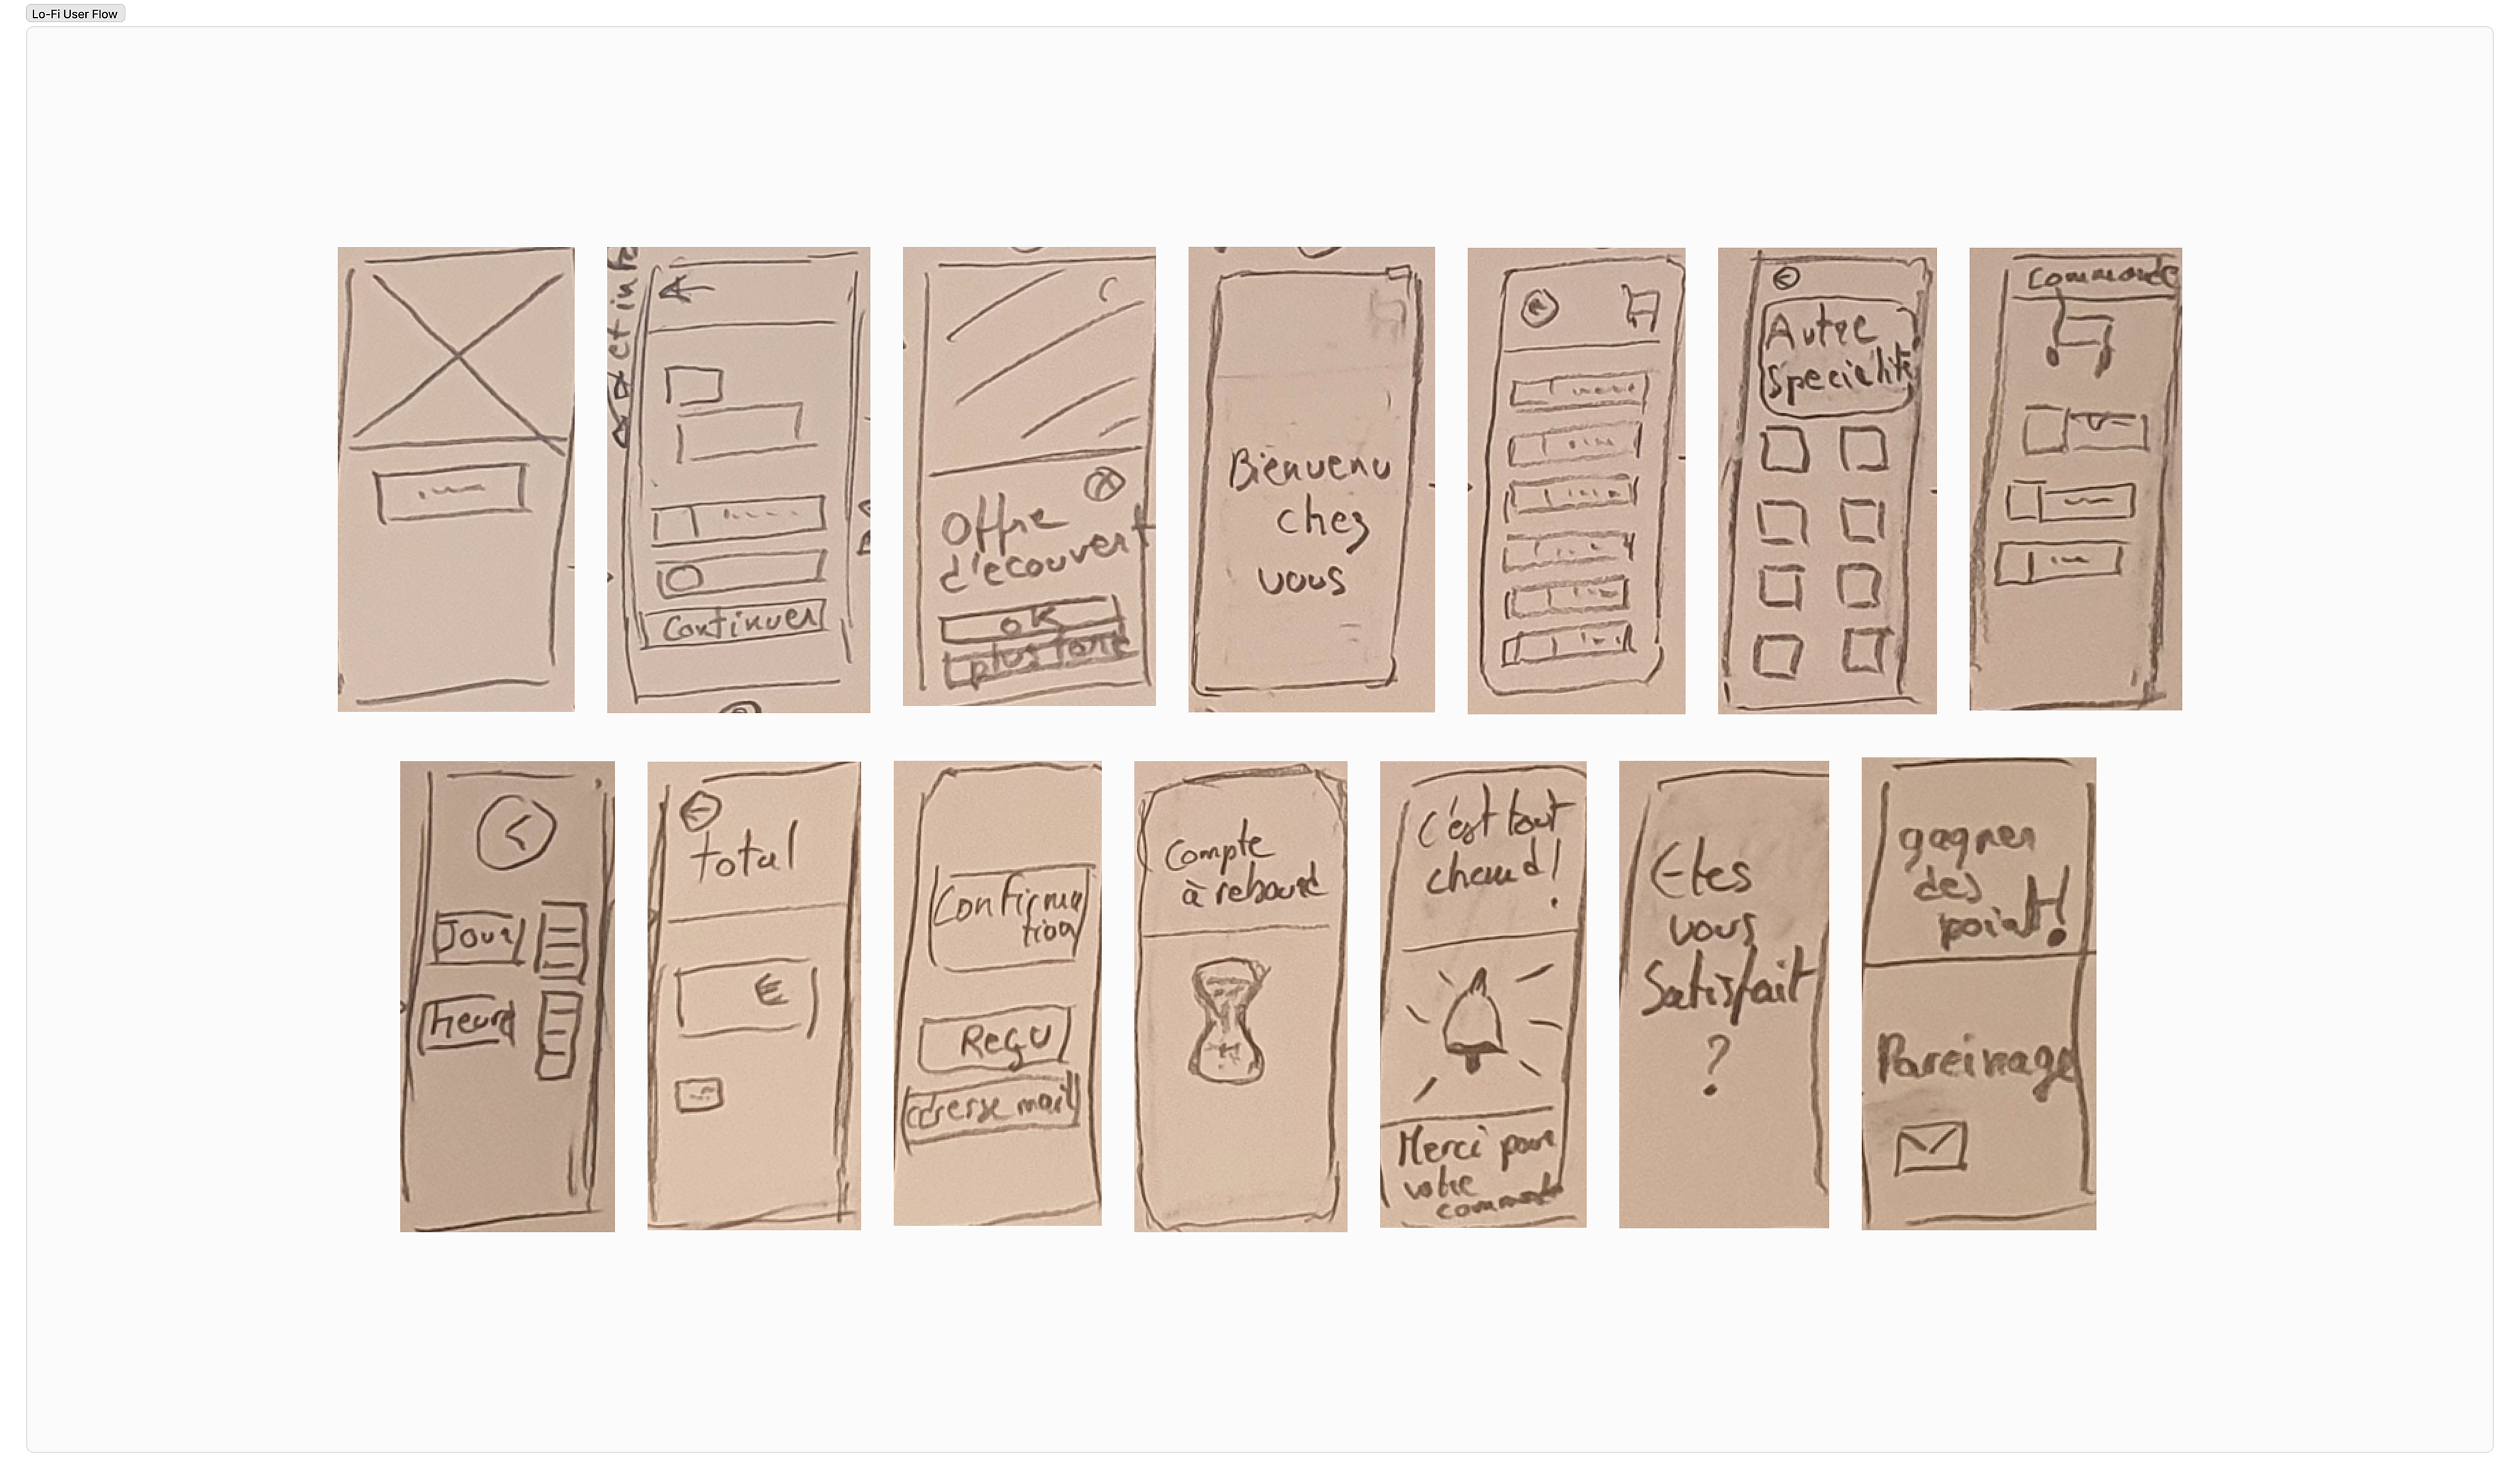
Low-fi sketches allow us to focus on core function and testing our solution, saving time and energy.
Mid Fidelity wireframes
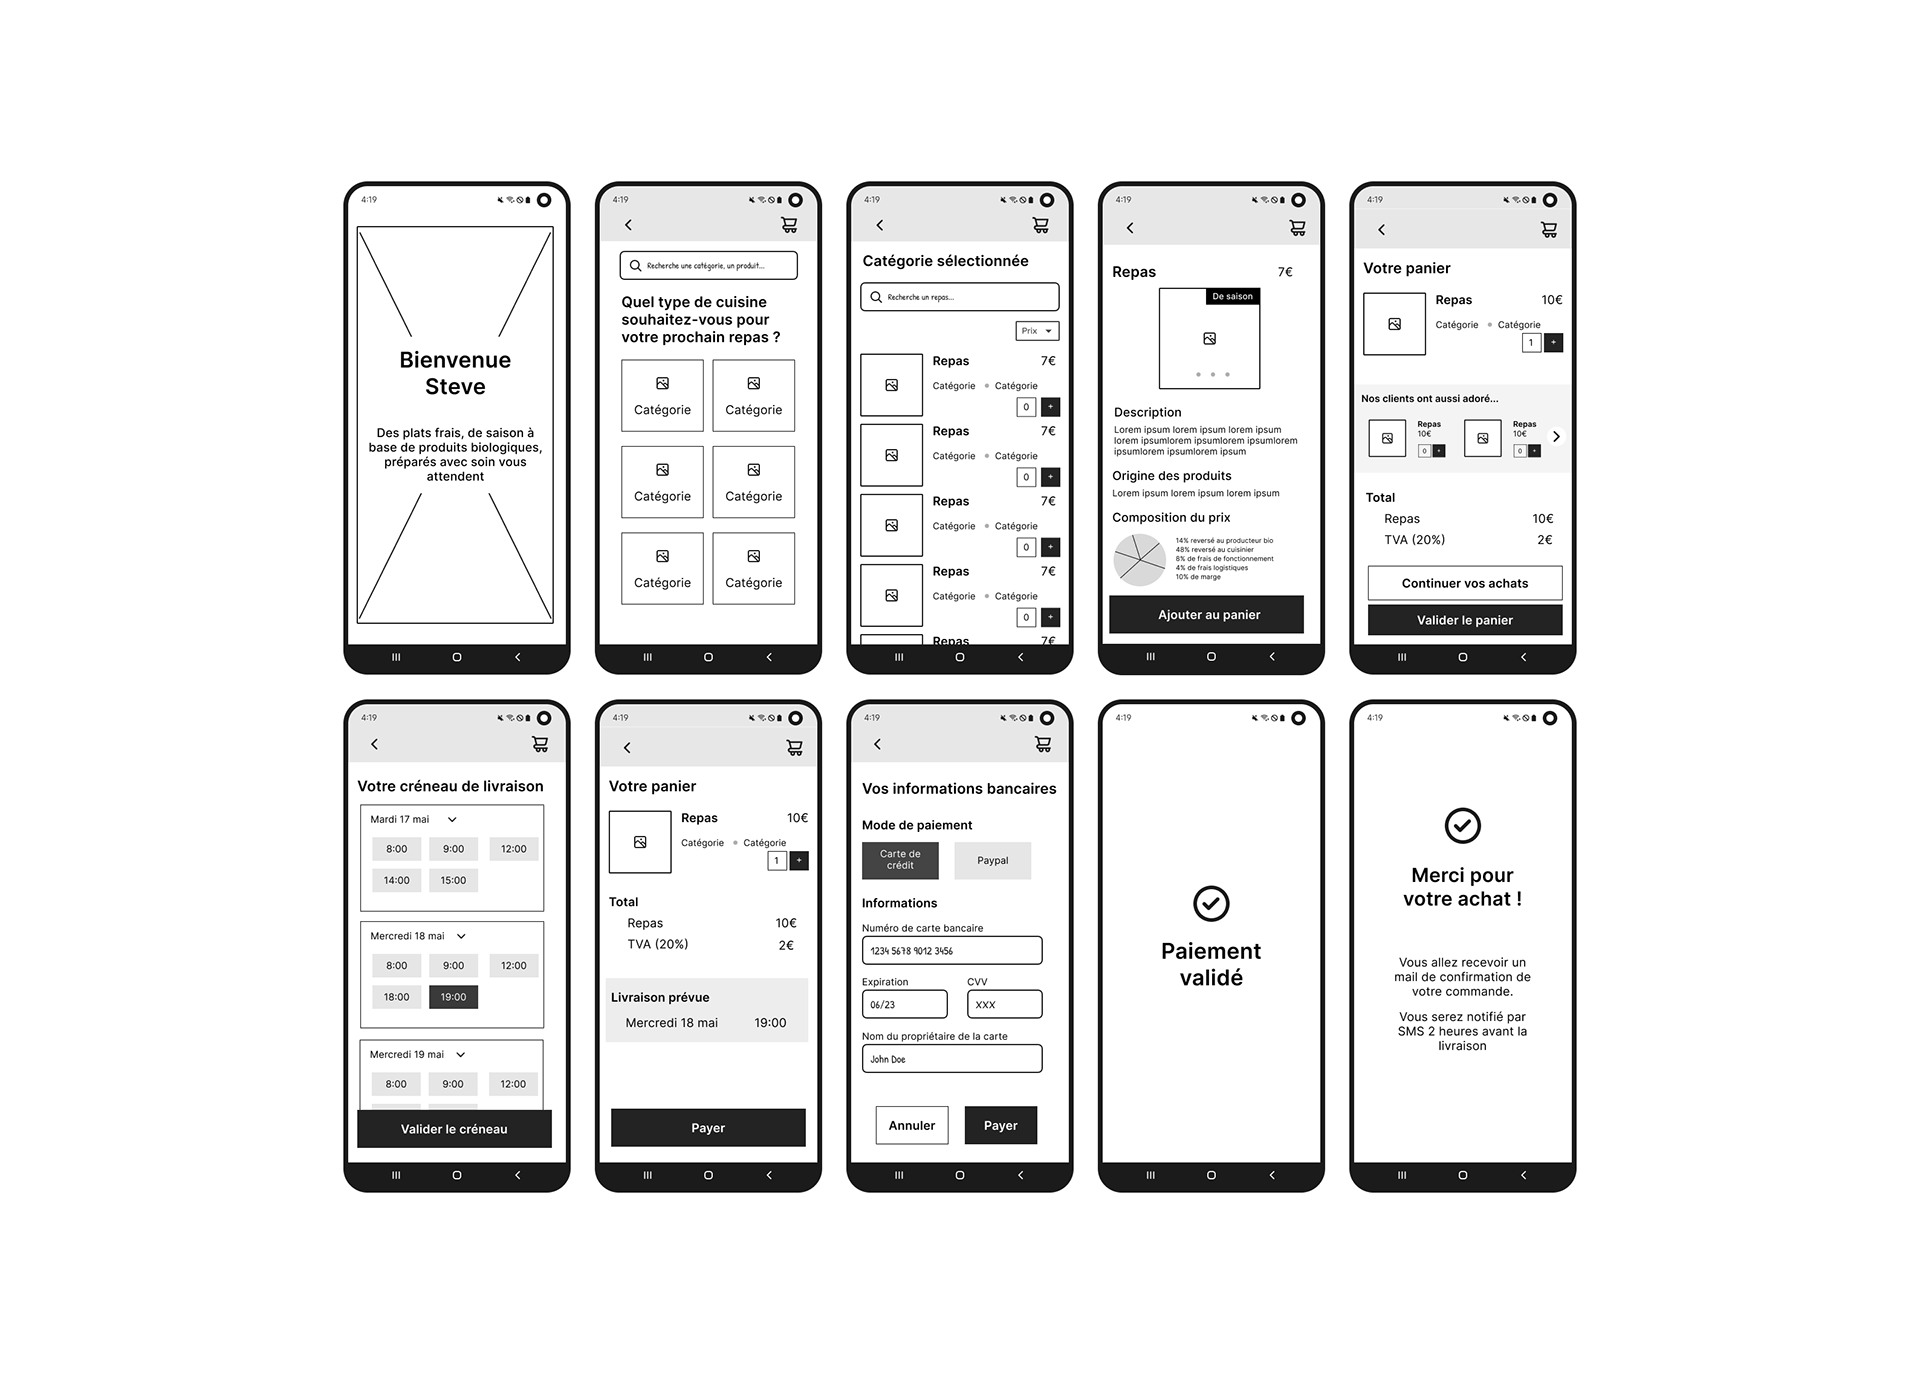
mid-fi prototype allowed to test our hypothesis.
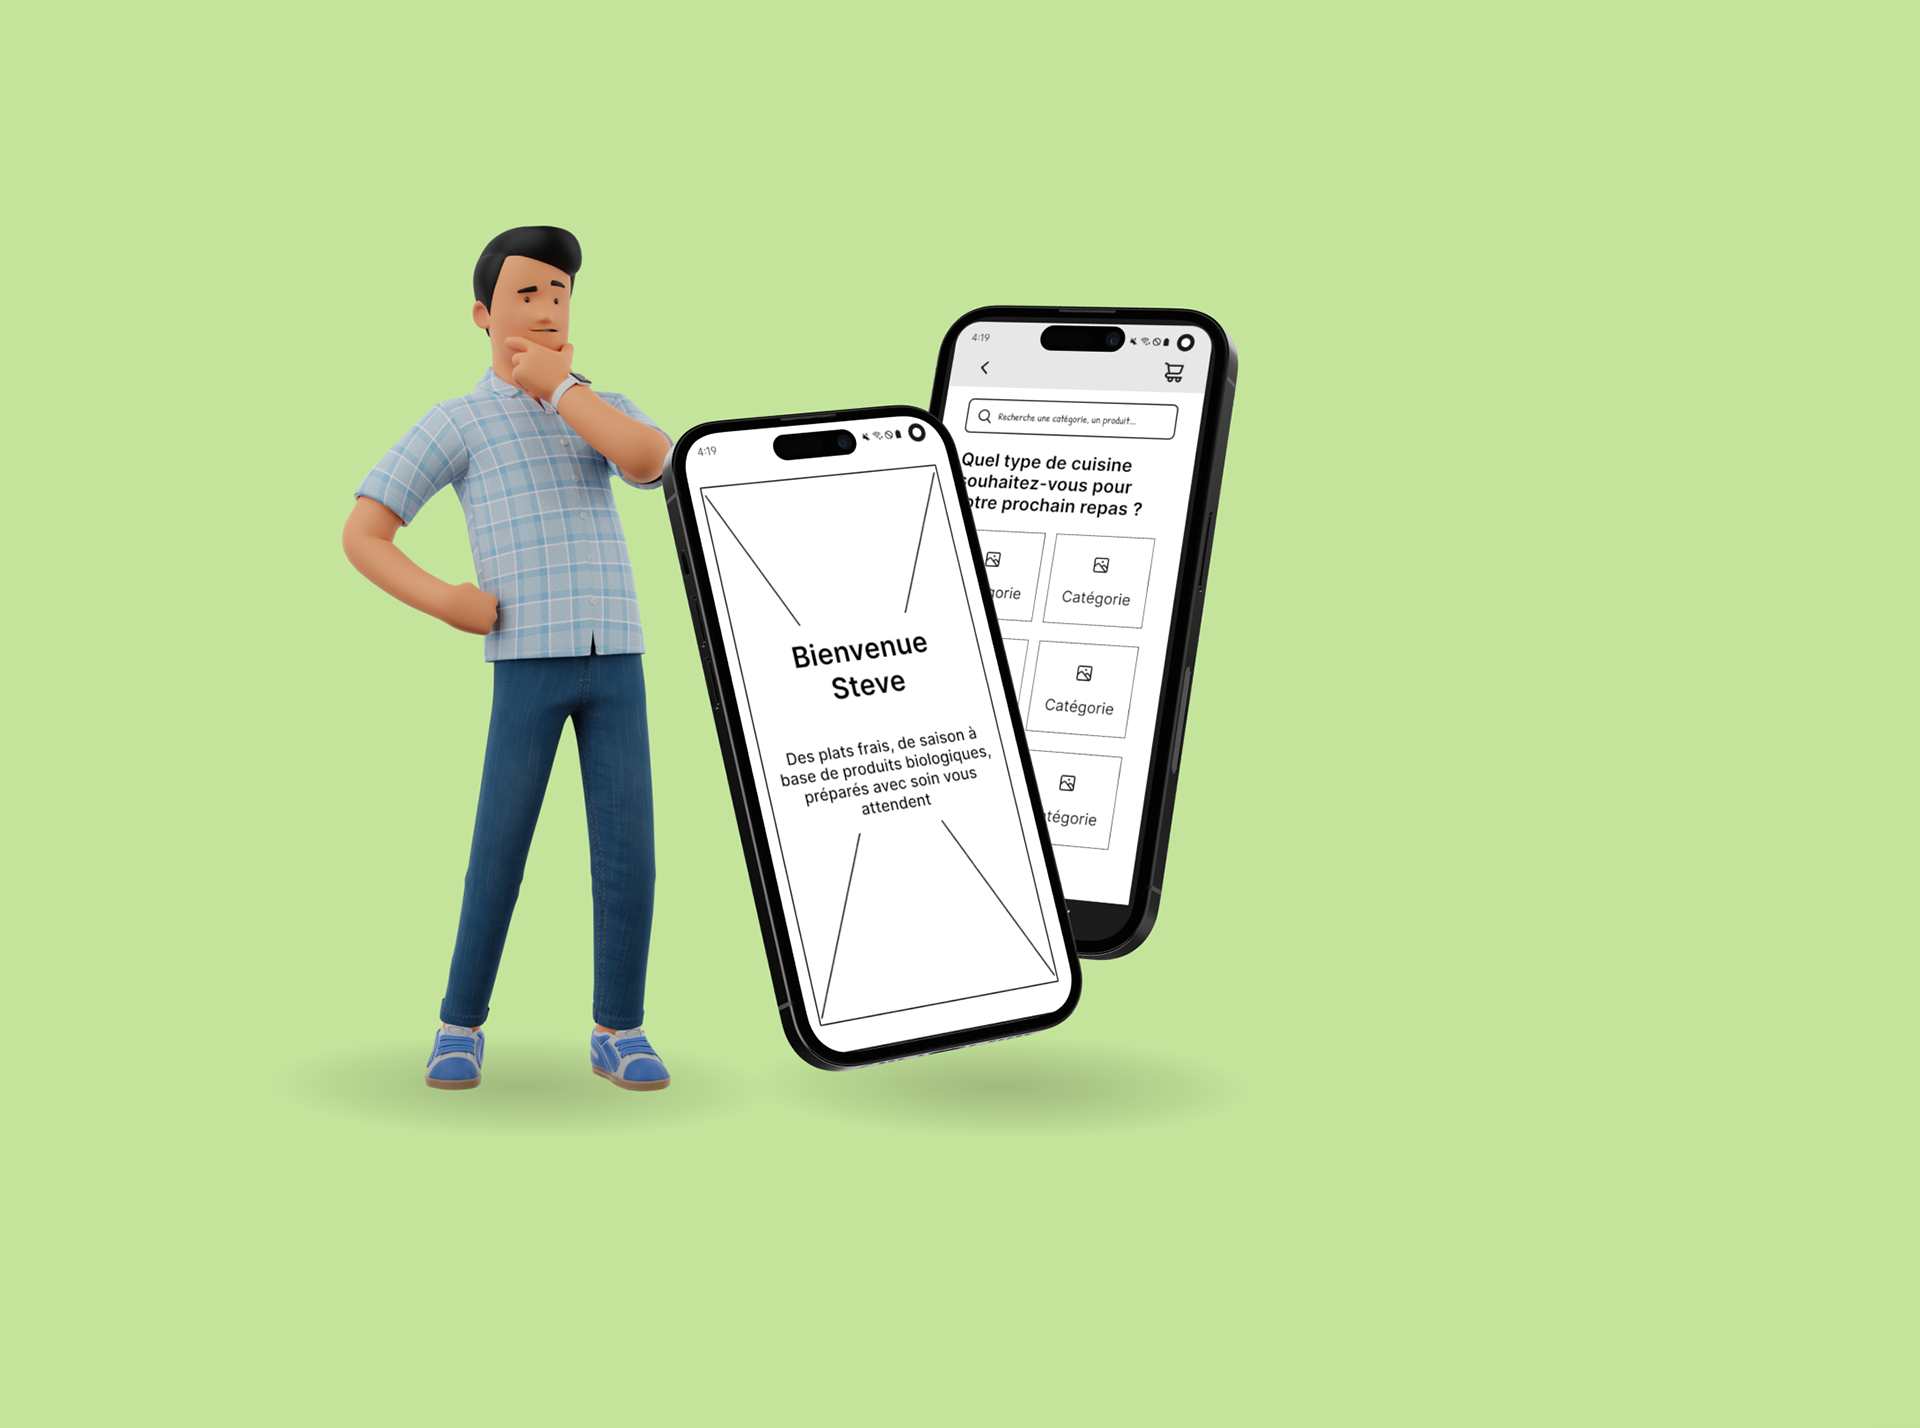
Prototype
An interactive prototype was built so we could test our response to the problem. We constantly refer to our persona Steve so that we reframe the problem, not as our own problem but as Steve's problem to be solved. Testing our hypothesis means, finding out if we have accurately defined the problem and if we have accurately responded to the problem.
Testing with 3 people
Two out of three, didn’t directly understand that these were ready-to-eat meals, but rather recipes to be prepared.
Two out of three, would like to plan the delivery of these meals over several weeks: to be able to choose meals every week.
Two out of three, had positive feedback on the “Meals” page, which highlights the origin of products and price transparency.
Finish
This concludes a 5 day sprint, an intense journey for a Design Thinking workshop. The steps include: Empathise, Define, Ideate, Prototype & Test. We found substantial evidence through interviews and secondary research in order to define the problems that gave us a solid foundation upon which we built a prototype that allowed us to test our hypothesis. This concludes our project, and I would like to continue to build upon this to develop upon our discoveries and produce a high resolution version. I thank my teammates for their support and collaboration.
Ideas for later
Improving our prototype
● Clarifying our weekly delivery concept
● Improving navigation for adding products
● Imagining which categories to highlight Additional features
● Deposit system for meal packaging
● Highlighting anti-gaspi dishes
● Improving navigation for adding products
● Imagining which categories to highlight Additional features
● Deposit system for meal packaging
● Highlighting anti-gaspi dishes
Additional features
● Deposit system for meal packaging
● Highlighting of anti-gaspi dishes
● Highlighting of anti-gaspi dishes
Lessons learned
● Importance defining "the problem"
● Importance of task sharing
● Time management and the search for rapid solutions
● Best to interview a minimum of 20 persons.
● Importance of task sharing
● Time management and the search for rapid solutions
● Best to interview a minimum of 20 persons.
Next Steps
I still question the accuracy of our response to this wicked problem. We need to iterate and create another prototype to conduct tests.
Thank you so much for your time and attention. This has been an exercise in Design Thinking and it allows us to explore the process for empathy oriented design.

Thank you for visiting.